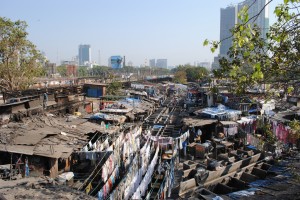
Slum in Mumbai: There is no questioning that these people are poor, but how do we assess their poverty? Photo by Sarah Jamerson via Flickr.
POVERTY lines are highly contentious. They are subject to criticism – tainted by politics, inhuman in design, divorced from reality – in the way they are created and used. The politics of counting the poor is not just limited to the national level but extends to international organisations such as the World Bank, United Nations and development programmes targeting services to specific populations.
In India, the Planning Commission has been overseeing the computation of the poverty line since 1979, when it came up with estimates based on a traditional consumption-basket approach. It was not until 1993 that the first comprehensive revision to the poverty line was conducted. The methodology was adjusted to account only for inflation and not for other factors like changing food- consumption patterns or deprivations in health, education and sanitation. In light of the absence of universal coverage for basic entitlements like food grains, subsidised healthcare and housing, the identification of people Below Poverty Line (BPL) is a highly sensitive issue.
In September 2010, the Indian planning commission stirred public outrage by setting the per capita poverty cut-off at 32 rupees (US$0.65/£0.41) a day for urban areas and 26 rupees (US$0.53/£0.35) a day for rural India. The figures were derived by revising estimates from the Tendulkar Committee report of March 2009, one of the special task-forces commissioned to review the BPL-determining methodology and figures.
Immediately after the release of these seemingly ludicrous numbers, condemnation by economists, activists, academics, media personalities and student unions in the country ensued. A statement by over thirty prominent economists in India, including a few who have worked with the government, declared, “We do not consider the official poverty lines set by the planning commission, at 32 and 26 rupees per capita per day for urban and rural areas respectively, to be acceptable benchmarks to measure the extent of poverty in India.”
35p a Day
In response to the uproar, Montek Singh Ahluwalia, deputy chairman of the implicated Planning Commission and a well-respected Indian economist, released a statement clarifying that the poverty line yielded by his team represented a monthly household budget of 4,824 rupees and 3,905 rupees for a family of five in urban and rural India respectively. These figures had been translated to the controversial per capita numbers of Rs. 32 and Rs. 26 quoted in public discussion, making the official poverty line “appear very low”. While, puritanically speaking, the calculus of transforming a household budget into per capita share is not as simple as a division of the total budget by the number of household members, viewing poverty lines in per capita terms is neither entirely surprising nor unintuitive. Poverty estimates the world over, including the World Bank calculation of US$1.25 per day, are expressed as expenditure per person.
In order to test the validity of the commission’s poverty line figures, two 26-year-old Indian expatriates, Tushar Vashisht and Matthew Cherian, launched an experiment to live on 32 rupees a day in a small town in the southern state of Kerala. In the first part of their exercise, they lived in Bengaluru on 100 rupees a day, an amount they arrived at after deducting rent from the average monthly per capita income in India. After spending three weeks at the “average expenditure” level in a metropolitan, they then proceeded to Kerala for their second phase of Rs.32-a-day.
While their experience in Bengaluru was extremely challenging and detrimental to their physical health, the second part was even more debilitating. There were common expenditure patterns under both budgets: food was the largest component of spending and they could only afford to drink well water. However, in the second phase, they faced more serious deprivations. They could not afford public transportation and were not able to meet the recommended 2000 calories a day. They were forced to rely on carbohydrates as the most filling meals included rice, wheat and plantains and most proteins, including eggs and dairy, became luxuries they could no longer afford. The month-long experiment took a toll on their weight and blood sugar levels, and they experienced fatigue and weakness throughout. “The nutritional intake (protein especially) is nowhere close to what we need. If it is not sufficient for us, it clearly doesn’t satisfy the requirements of someone who does hard labour with greater caloric needs,” they note in their blog.
What does it mean to be “poor”?
In October 2011, the government, in response to the commotion, announced that the poverty numbers would not be used to cap out people benefiting from government schemes and programmes ensuring basic entitlements. It also declared that it would consider multiple dimensions of poverty to better target policies. What might it mean for India if it begins to look at multiple dimensions of poverty instead of the expenditure- based deprivation it currently does?
The fact that poverty is not just the paucity of income is not an idea limited to the academic discourse spearheaded by Nobel-prize-winning economist Amartya Sen. People living in poverty admit that their well-being, or lack thereof, is a function of multiple facets of life, such as the lack of education, access to health services, housing, employment opportunities. An index called the Multidimensional Poverty Index (MPI) developed by Oxford Poverty and Human Development Initiative (OPHI) at the University of Oxford incorporates three dimensions of poverty – education, health and living standards – and aims to capture deprivations beyond income for 109 countries.
The poverty “dimensions” are further represented by measurable indicators that help capture the concepts of health, education and living standards in numerical terms. The education element of the index, for example, is reflected through years of schooling and school attendance, while child mortality, nutrition, sanitation, water, electricity are some of the seven dimensions representing health and living standards. Based on national surveys conducted by the government of India in 2005, OPHI’s MPI revealed that 53.7% of the population was “poor”. For the same time period, the percentage of people ‘income poor’ as per the World Bank threshold of US$1.25 was 41.6% whilst the Tendulkar Committee Report placed the percentage at 37.2%.
Relative Poverty
While the disparity in the headcount of poverty may become significantly larger by expanding the definition of poverty, the more pertinent advantage of a holistic measurement such as the MPI is that it allows for the government to understand what areas make its people suffer the most. For instance, among the people that are considered multi-dimensionally poor in India by the MPI, the biggest contributor to deprivation is nutrition. Furthermore, the MPI data shows that the MPI-poor living in rural India are more severely deprived than those living in urban poverty and the reasons for their deprivation are different; school attendance is a bigger contributor to multidimensional poverty in the urban areas whereas electricity is a larger factor in rural parts.
As director of OPHI, Dr. Sabina Alkire, pointed out in an interview with the Economist, by focusing on the intensity of deprivations suffered by the people considered multidimensional poor, the MPI serves as a clear tool to target the poorest: “because of the way our measure is constructed you can look at who is deprived in 90%, 80%, 70% of the attributes”. The MPI provides a ‘sliding scale’, as Dr. Alkire calls it, that is more accurate than the sliding scale of income in identifying the poorest because it looks at multiple dimensions, making targeting of social programmes less error-prone. Mexico, for example, has adopted a contextualised MPI that reflects its policy goals by putting weights on the dimensions that are relevant to the country. The index allows Mexico to design relevant poverty-reduction strategies and modify the index from time to time to reflect the changing nature or poverty in the country and the conjunctive changes in the goals of the government.
The debates surrounding poverty measurement are many and that in a way suggests the challenges a policy-maker has to face in designing poverty lines. In a country like India, sub-national variations in any indicator or proxy in capturing poverty are large, making the exercise of creating homogenizing measures like BPL even more complicated and subject to criticism. However, aiming to merely raise income of people in a country may not be the solution to improving social indicators because higher income does not guarantee access to basic human entitlements. Counting the poor is an important step in poverty- reduction strategy, but it succeeds the first crucial step: rethinking what it means to be poor today.


